Speed: the fastest year since 2018
The average visit took 5:24, which is 11.1 seconds faster than 2025 and 58 seconds off the 2021 peak. Nearly all of the gain came from service time, and most of that came at the pickup window, where average window time fell 7.5 seconds to 1:40.
The average hides a long tail. Half of all visits finished in under 4:25, but the slowest 10% ran past 9:56. Those long visits are where loyalty slips: when a visit topped 10 minutes, only 60.4% of guests said they would recommend the brand.
Accuracy: the best result in nine years
89.3% of orders were filled correctly, up 2.4 points from last year. Just 10.7% of orders had something wrong, the lowest share since the study’s 2018 series began. Customization was the leading problem, behind 43% of inaccurate orders. Errors were also more common in the afternoon and at dinner than at breakfast and lunch.
Perceived speed shapes satisfaction
How fast a visit feels matters as much as the clock. Guests who said their visit was quicker than expected reported 96.8% satisfaction, and 65.3% were very likely to recommend. When it felt slower than expected, satisfaction fell to 82.3% and only 12.8% were very likely to recommend.
Lane flow tells the same story. Visits rated perfectly smooth averaged 4:45 with 97.1% satisfaction. Visits rated frustrating averaged 11:18, and satisfaction dropped to 42.9%.
Friendliness is still the foundation
Overall satisfaction reached 93.8%, up from 91.2%. Friendly service remains the strongest single driver. When shoppers rated service as friendly, 98.6% were satisfied, and good or excellent value ratings climbed with it. Value, the study shows, comes from several strengths at once: accuracy, friendliness and secure packaging, not speed alone.
Voice AI is maturing, but slowly
In the main study, a voice AI took some or all of the order on just 36 of 2,145 visits. In the dedicated AI sample, the AI started 92 orders and completed 77 on its own.
Compared with visits to the same brands in the main study, AI-enabled locations scored higher on accuracy (90.8% vs. 86.7%), suggestive selling (79.2% vs. 59.2%) and satisfaction (94.2% vs. 91.7%). Total time was nearly identical, and guests had to repeat part of their order more often (29.1% vs. 20.4%). The study notes that AI locations were selected rather than randomized, so these comparisons are descriptive.
What it means for your lanes
The 2026 results reward consistency. Averages improved, but loyalty is won or lost on the outliers. Four priorities stand out.
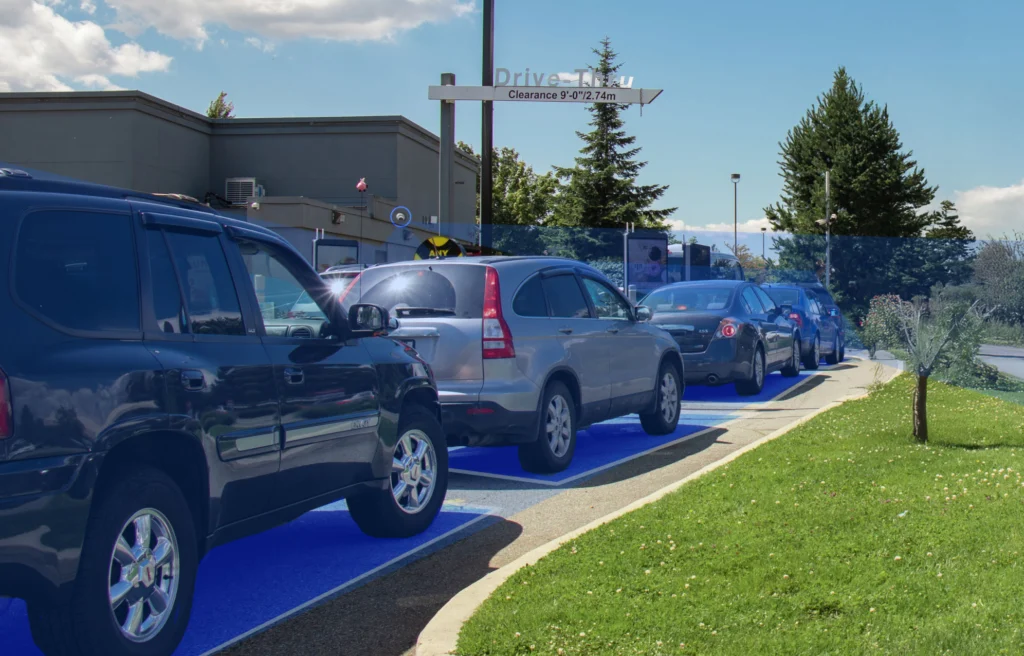
Manage the slowest cars, not just the average. The slowest 10% of visits ran past 9:56, and recommendation rates dropped sharply once a visit passed 10 minutes. Finding where those cars stall matters more than shaving seconds off a typical order.
Make the visit feel fast. Guests whose visit felt quicker than expected were five times as likely to strongly recommend the brand. A lane that flows without hitches feels faster than the clock says.
Protect the customized order. Customization drove 43% of errors. Special requests deserve extra care at the speaker, on the screen and at the window.
Keep hospitality in the lane. Visits rated friendly reached 98.6% satisfaction. The best technology frees crews to focus on guests, not replace the connection.
Every second, every order, every guest. See how HME helps you make each one count.
What operators ask us
What was the average drive thru time in 2026?
The average total time was 5:24, 11.1 seconds faster than 2025 and the fastest result since 2018.
Does voice AI make the drive thru faster?
Not in total time. AI-enabled locations averaged 5:14 versus 5:15 for the same brands in the main study, though they scored higher on accuracy, suggestive selling and satisfaction.
Source: 26th Annual Intouch Insight Drive Thru Study, in partnership with QSR Magazine.