
Speed of Service
Your total lane time from entry to exit. The single most-watched metric in drive thru operations and the clearest indicator of how efficiently your lane is running at any given moment.

DRIVE THRU ANALYTICS
The metrics are only as useful as the system tracking them. HME gives you the analytics to see exactly where your drive thru is winning, where it’s losing time, and what it takes to close the gap between your current performance and your goal.
Your total lane time from entry to exit. The single most-watched metric in drive thru operations and the clearest indicator of how efficiently your lane is running at any given moment.

How many cars your drive thru serves per hour, per daypart, or per shift. Throughput tells you how much revenue capacity your lane is generating and where that capacity is being left on the table.

How your operation holds up during its busiest hours. Peak-period data separates your locations that scale well under pressure from those that slow down precisely when speed matters most.

Cars that leave your lane before placing an order represent revenue that’s already gone. Tracking drive-offs gives you a real number behind lost transactions so you can act before it becomes a pattern.

Track how long cars spend at each stage of your drive thru journey, from order point to payment to pickup window, so you know exactly where time is being gained or lost rather than guessing from a total service time alone.

The gap between the performance targets you set and the results your locations actually deliver. Tracking this across shifts, dayparts, and locations is what turns your data into a coaching tool rather than just a report.
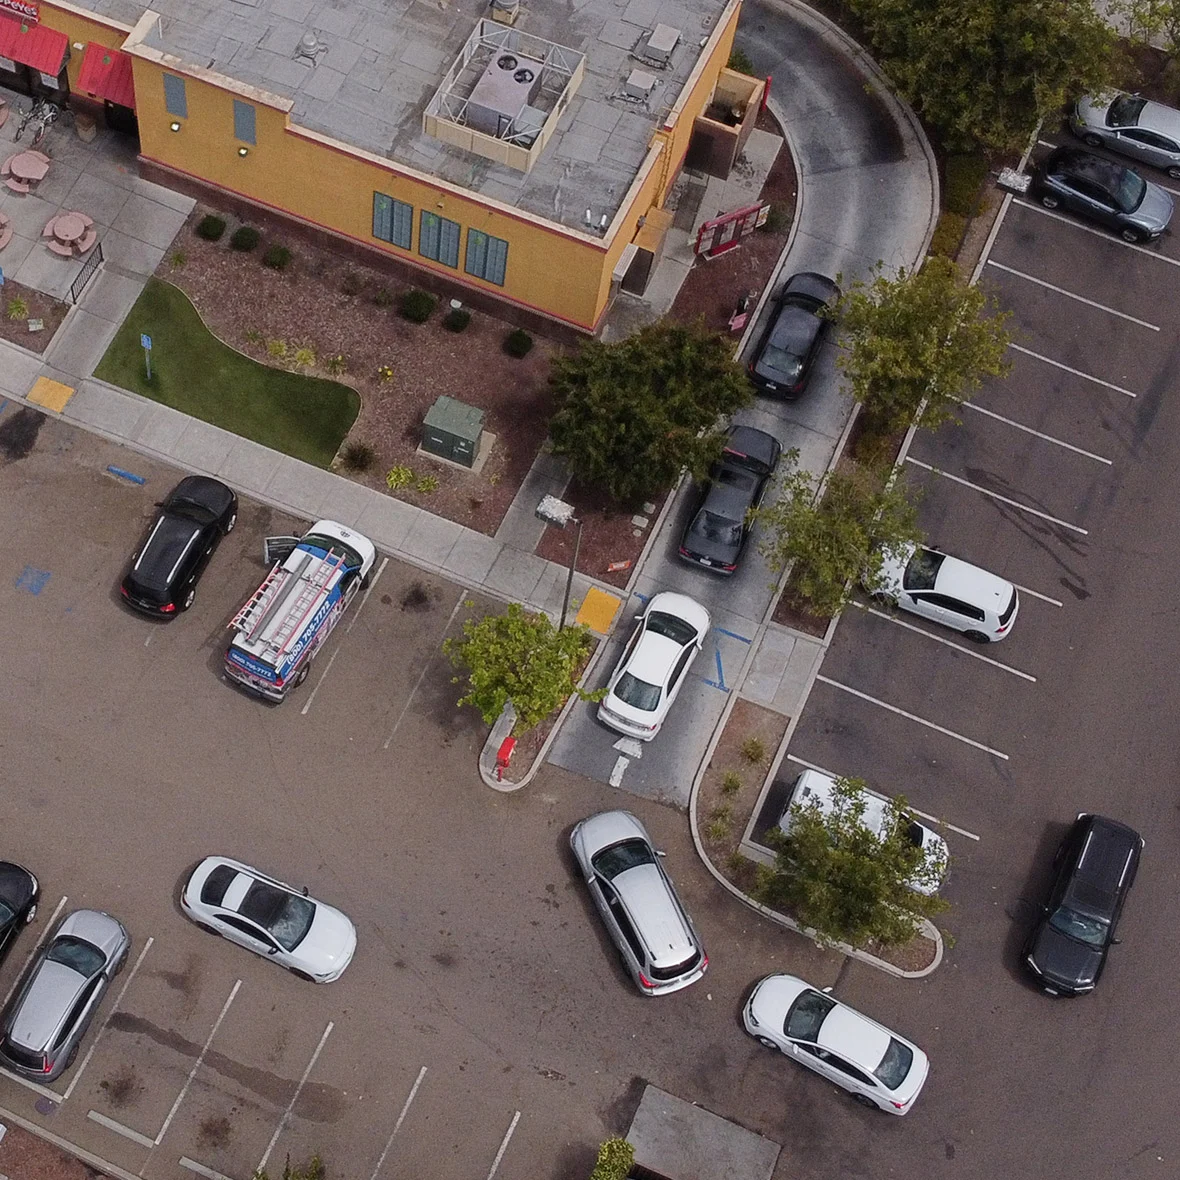
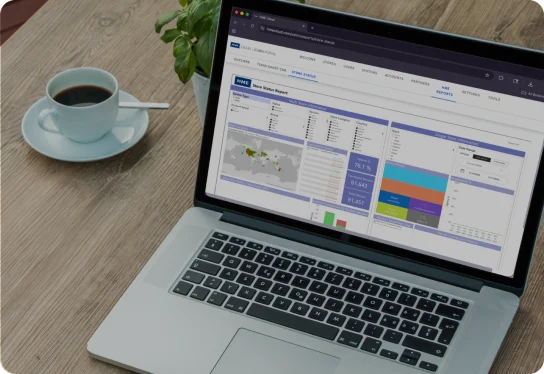
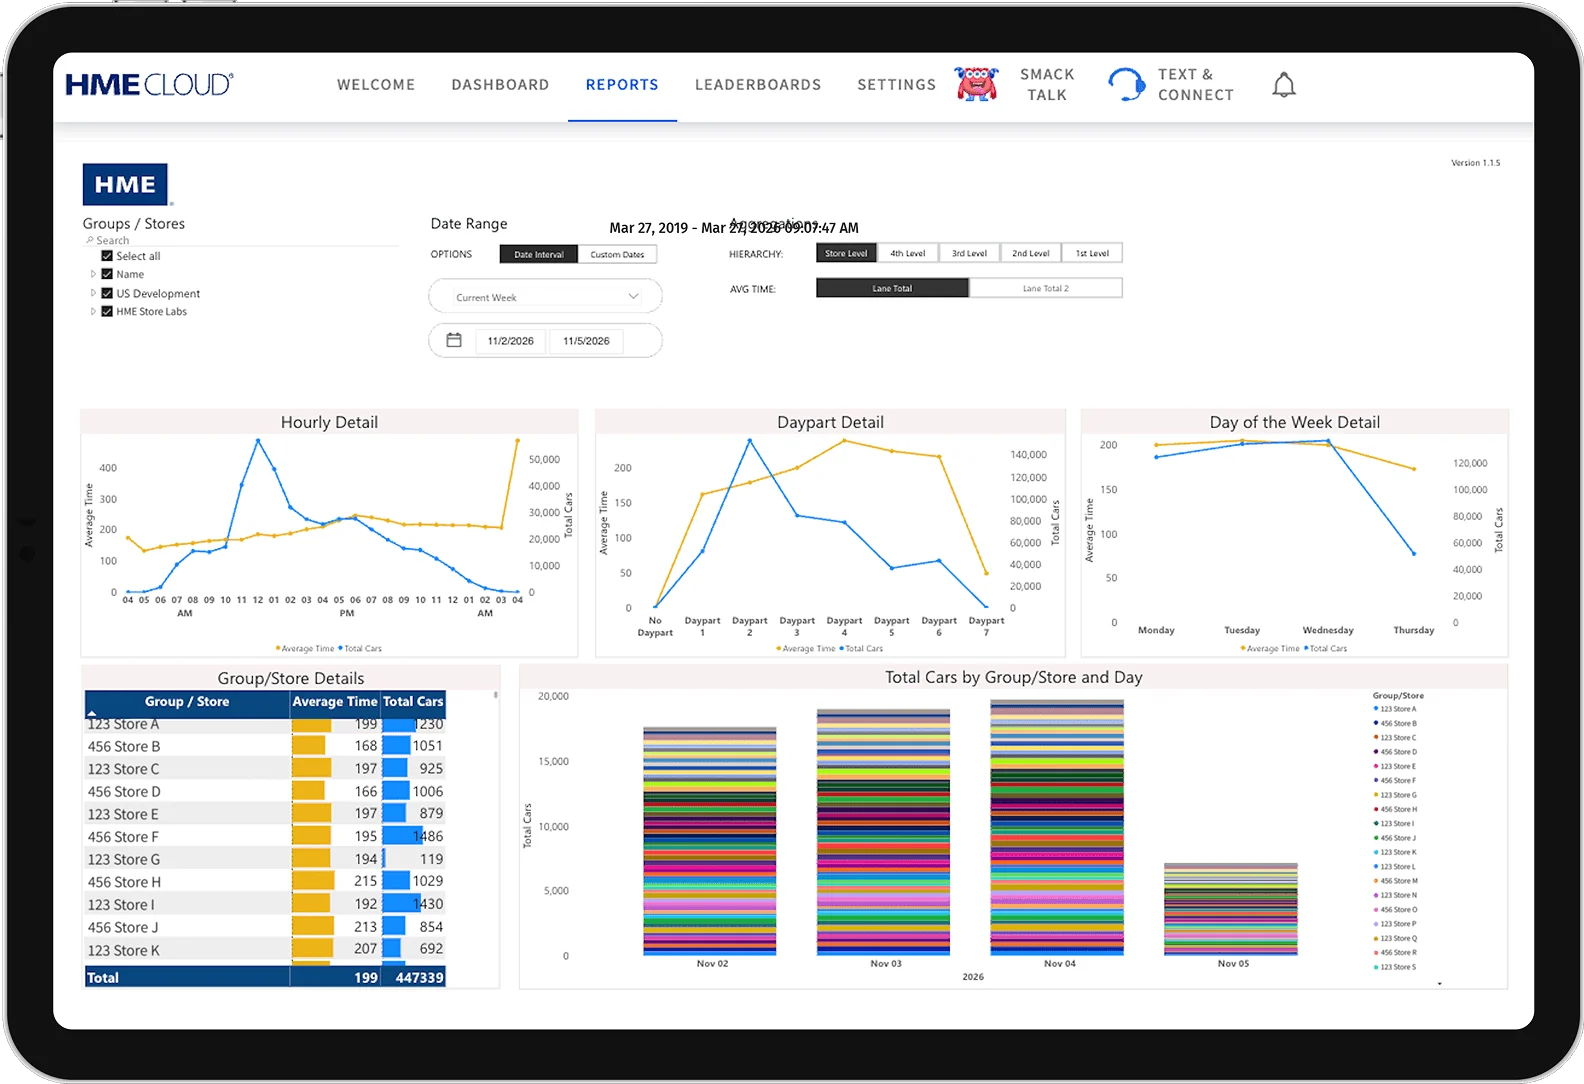
From your in-store dashboard to above-store reporting, you get the visibility to see what’s happening now and the historical data to understand why it happened, across every location you manage.
01
Every shift needs a target. Set speed of service goals, car count benchmarks, and stage-time standards by daypart or location so performance has a clear definition before the first car pulls in.
02
Your in-store dashboard gives crew members and shift managers a live view of lane performance as it happens, so bottlenecks get flagged and addressed in the moment rather than discovered after the rush.
03
Above-store reporting lets you see how every location in your portfolio is performing relative to each other and relative to your goals, so you can surface your best operators, identify where support is needed, and close the gap between your top and bottom performers.
04
When you can show a shift leader exactly where their location is losing time, at which stage, at which hour, coaching becomes specific and evidence-based rather than subjective. The data does the hard part.
4:15
The industry average total service time in 2025, ten seconds slower than the year before. The trend is moving in the wrong direction.
Source: 2025 Intouch Insight
257s
The average service time for the fastest QSR brand in 2025. That's the benchmark your operation is being measured against, whether you know it or not.
Source: 2025 Intouch Insight Drive Thru Study
87%
Industry-wide order accuracy in 2025, down from 89% the prior year. Two percentage points may sound small. At high volume, it isn't.
Source: 2025 Intouch Insight Drive Thru Study / QSR Magazine
90%
Of consumers rank speed as their top priority in the drive thru experience. Miss it consistently, and you're missing what matters most to your customer.
Source: 2025 Intouch Insight Drive Thru Study
From single stores to national brands, operators count on HME to keep crews connected and cars moving. Here’s what they have to say.

RESOURCES
The core metrics operators track are speed of service, throughput and car counts, peak-period performance, drive-offs, time by touchpoint, and goal vs. actual. Together these give you a complete picture of how your lane performs, where time is being lost, and how your locations compare to each other and to your own targets.
Industry benchmarks vary by brand and segment, but the 2025 Intouch Insight Drive Thru Study recorded an industry average of 4 minutes and 15 seconds. The fastest QSR brand averaged 257 seconds. Most operators set their own internal targets by daypart and location type rather than chasing a single industry number.
Throughput is the number of cars your drive thru serves per hour, per daypart, or per shift. It tells you how much revenue capacity your lane is actually generating. A lane running below its throughput potential is leaving money on the table every shift, even if individual service times look acceptable.
Drive-offs are cars that enter your drive thru lane but leave before placing an order, typically because the line is too long or moving too slowly. Tracking drive-offs gives you a real number behind lost transactions. Reducing them starts with understanding when and where they happen most, which requires stage-level timing data rather than total service time alone.
Start with stage-level timing data that shows where your lane slows down, at which touchpoint and which hour of the day. When you can show a shift leader exactly where time is being lost, coaching becomes specific and evidence-based rather than a general conversation about being faster.
Above-store reporting aggregates performance data across every location in your portfolio, letting you rank locations, surface outliers, and identify which stores are consistently hitting their goals and which need support. The most useful comparisons are by daypart and location type rather than raw service time alone.
Goal vs. actual tracks the gap between the performance targets you set and the results your locations deliver. It turns your data from a historical record into an active management tool, giving managers and crew a clear, shift-by-shift picture of whether they’re hitting the mark.
The most effective operators review real-time data during the shift to catch bottlenecks as they happen, daily summaries to identify trends from the prior day, and weekly or monthly above-store reports to track progress against goals and compare locations. The cadence matters less than the consistency.