

A Clear Picture of Your Operation
Operators who understand their drive thru at a stage-by-stage level stop reacting to problems and start anticipating them. Visibility is the first step.

DRIVE THRU INTELLIGENCE
The fastest drive thrus aren’t just faster. They’re better informed. They know where their lanes slow down, when it happens, and why, and they use that knowledge to fix it before customers feel it.
The cost of a blind spot isn’t just one slow shift. It’s the same slow shift, repeated, because without data, every decision is a guess, and every guess leaves throughput on the table.
Operators who understand their drive thru at a stage-by-stage level stop reacting to problems and start anticipating them. Visibility is the first step.

Slow service is a symptom. Operators who dig into the data find the actual cause and fix it at the source instead of managing around it.

Without performance data, coaching is subjective. With it, managers can have specific, evidence-based conversations that actually move the needle over time.

When you can see how your best locations operate, you can replicate it. Multi-location visibility turns your top performers into a playbook for the rest of the portfolio.


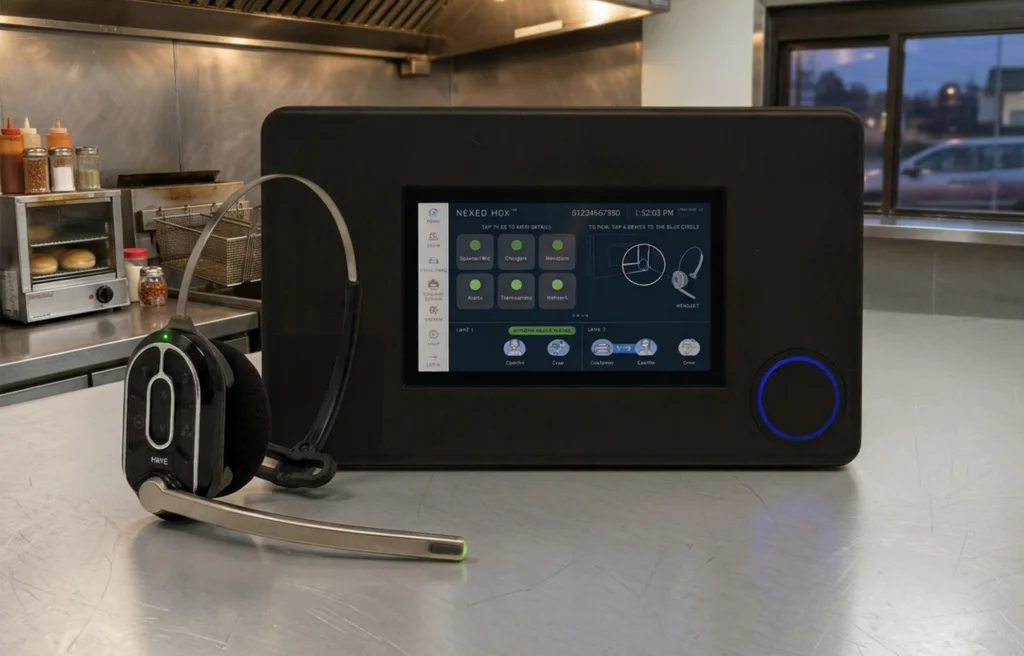
HME’s drive thru intelligence capabilities are built on a connected layer of hardware, software, and cloud-based reporting that turns raw lane data into the kind of visibility operators can actually act on.

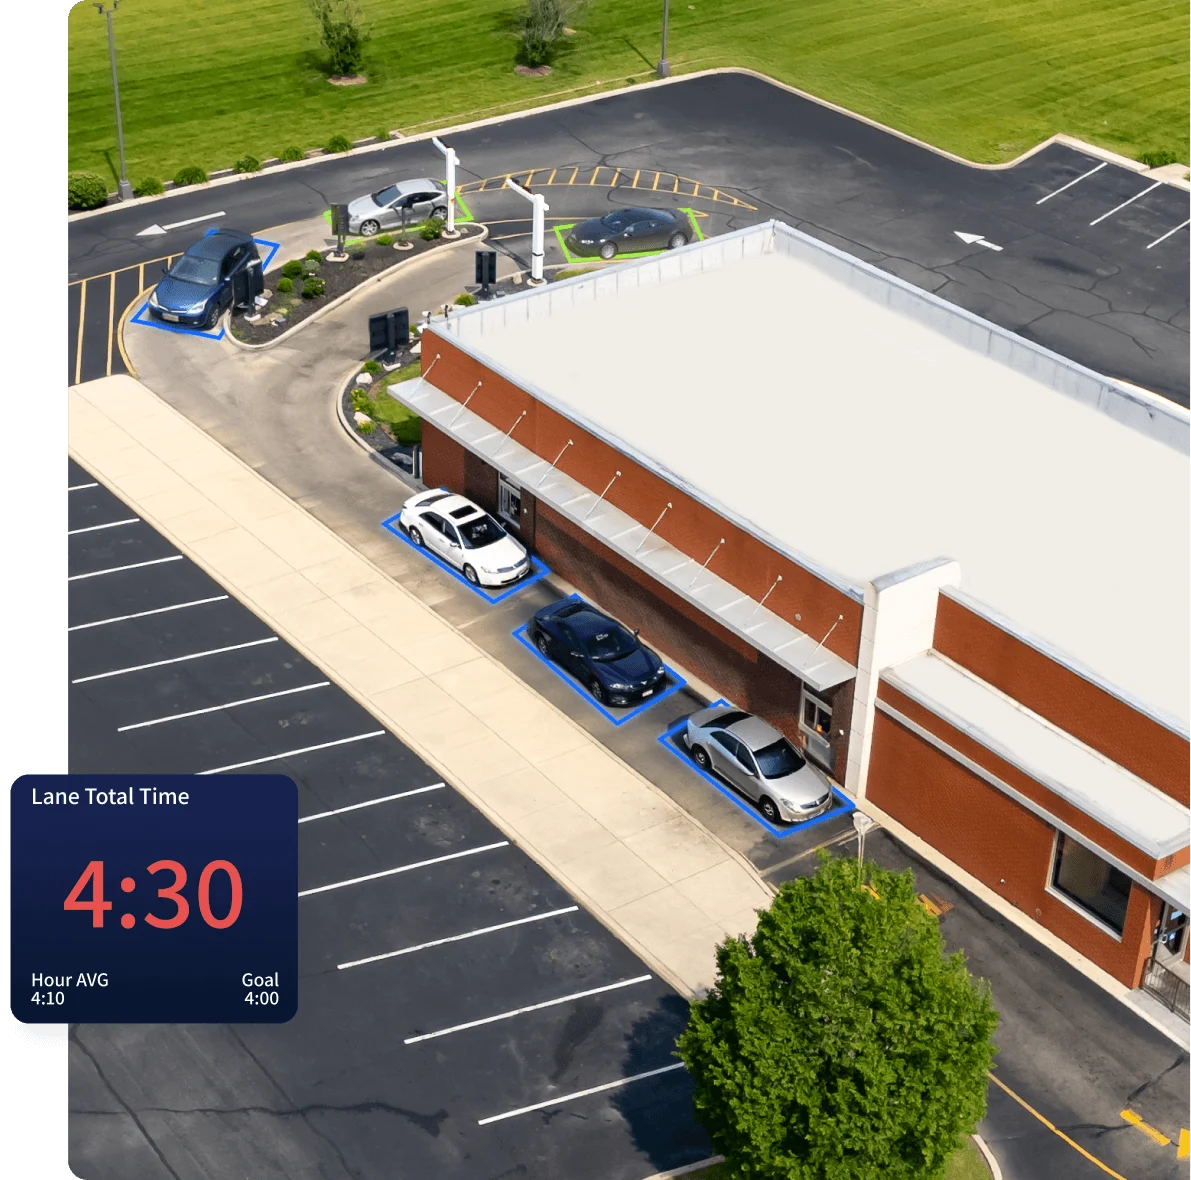
Cameras and ZOOM Nitro timing, working together. It follows each car from arrival to exit, flags bottlenecks in real time, and routes performance alerts directly to crew headsets.

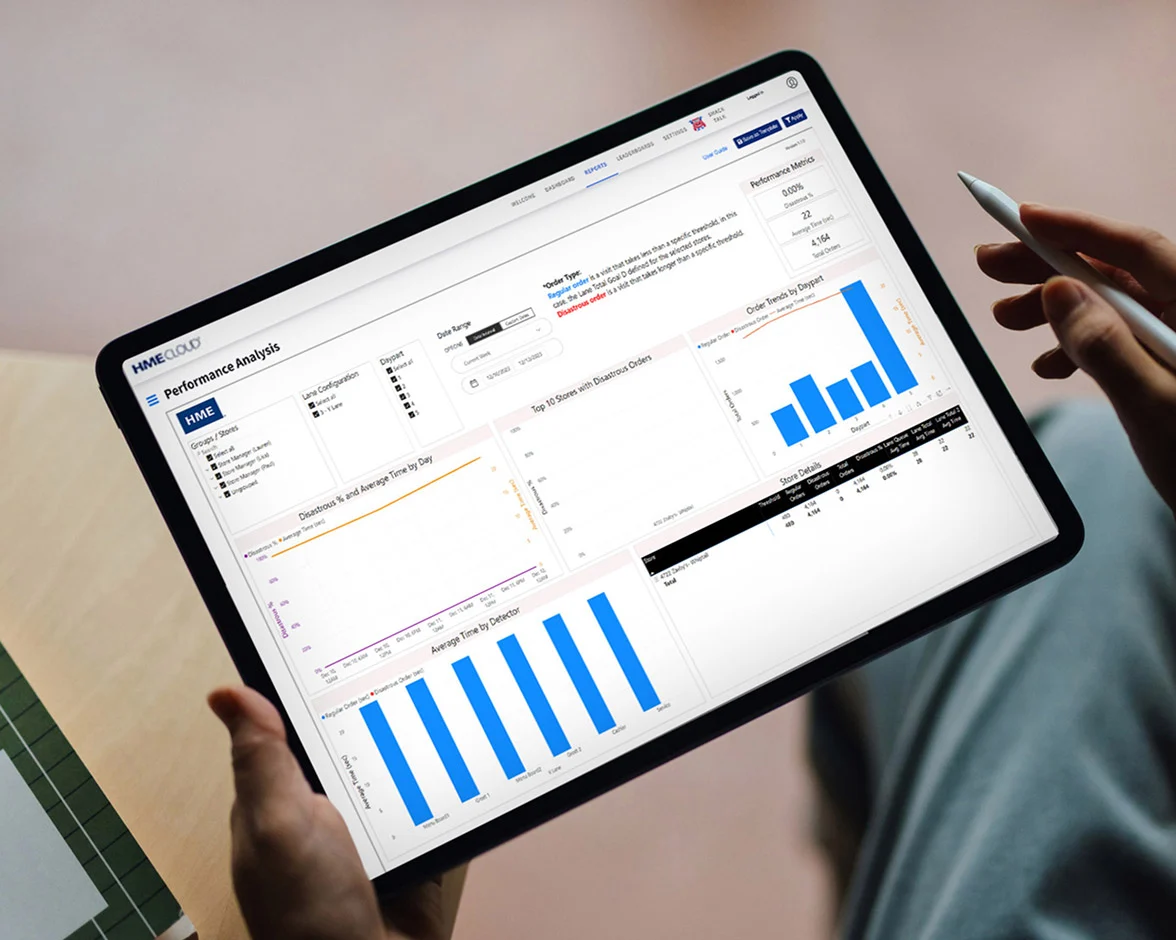
The reporting layer that turns raw performance data into trends, comparisons, and actionable insight across single stores and entire portfolios.
65%
The share of QSR orders now coming through the drive thru. Mobile, delivery, curbside, and dine-in account for the rest, multiplying the number of order points operators have to watch at once.
Source: Revenue Management Solutions
92%
Of consumers say they would leave a drive thru line heavy with cars. Speed and throughput aren't just operational metrics, they're retention metrics.
Source: Global Payments QSR Drive Thru Study
240s
The speed-of-service benchmark that separates top QSR operators from the industry average of around five and a half minutes. The gap between best and average is measurable, and closeable.
Source: Pulse RevOps
62%
Of QSR leaders say labor is their most pressing challenge, making every crew member's efficiency, and every lane's performance, critical to the bottom line.
Source: 2025 Intouch Insight Drive Thru Study
From single stores to national brands, operators count on HME to keep crews connected and cars moving. Here’s what they have to say.

Drive thru operational intelligence is the practice of using real-time and historical performance data to understand what’s happening in your lanes, identify where slowdowns occur, and make decisions that improve speed, accuracy, and consistency. It’s less about any single tool and more about how operators use data to run a tighter, more visible operation.
The core metrics operators track include speed of service, wait time, service time, car counts, and order accuracy. The most sophisticated operators go deeper, breaking performance down by stage, daypart, and location to identify where and when their operation underperforms relative to goals or benchmarks.
A bottleneck is any stage in the drive thru process where cars slow down or queue builds up beyond expected levels. Common bottlenecks include the order-taking stage during peak hours, payment delays at the window, and large orders that hold up the line. Identifying which stage is causing the slowdown is the first step to fixing it.
Bottleneck identification starts with stage-level timing data. By tracking how long cars spend at each point in the journey, from arrival to exit, operators can pinpoint exactly where time is being lost rather than relying on total service time alone, which can mask where the real problem is.
Multi-unit operators typically rely on above-store reporting dashboards that aggregate performance data across every location in their portfolio. This allows them to compare locations, surface outliers, identify top performers, and prioritize where coaching or operational changes will have the most impact.
Drive thru timer systems, vehicle detection technology, and cloud-based reporting platforms are the core tools operators use to capture and analyze lane performance data. When these systems are connected, operators gain a real-time and historical view of their operation that makes bottleneck identification and performance coaching significantly more actionable.
Performance data gives managers a factual basis for coaching conversations rather than relying on memory or perception. When a manager can show a crew member or a shift leader exactly where a stage is running slow, at what time of day, and by how much, coaching becomes specific, measurable, and more likely to produce lasting improvement.